Diagnostics tools on a DOCSIS network have traditionally been part of a reactive, break-fix methodology, where the operator is notified about issues in their plant AFTER service for subscribers have been impacted. In fact, it is often complaints from one or more subscribers that prompts the operator to start a search for the cause of an issue using their diagnostics tools.
What is DOCSIS Proactive Network Maintenance (PNM)?
DOCSIS Proactive Network Maintenance (PNM) is a technology designed to let cable operators know where the faults are in their plant before service is impacted for the subscriber. DOCSIS PNM was initially developed within CableLabs®. It leverages the pre-equalization data from customer premises equipment (CPE) to determine where upstream impairments like micro-reflections and group delay are impacting service. This article explains in detail what DOCSIS PMN is, how the technology works, and why PMN can be an invaluable tool for your maintenance staff.
What is DOCSIS Pre-equalization?
First, I think it's necessary to take a moment to explain what pre-equalization (pre-eq) is and how that important feature in the CMTS powers PNM technology. Pre-eq was introduced in DOCSIS 1.1, and expanded on in DOCSIS 2.0, as a way of compensating for RF issues in the cable plant. When the CMTS sees the signal coming from a specific customer device, it can tell if that signal is distorted with issues such as tilt, roll-off, or in-channel standing waves. Since the CMTS knows what's wrong with the signal and to what degree, it can periodically tell the CPE to pre-distort its signal to cancel out the effects of that impairment. Basically, the CMTS tells the cable modem to send the inverse signal of the one originally received so that when the pre-equalized signal is received by the CMTS it looks much closer to an ideal signal. In fact, just by enabling pre-equalization on the CMTS you can see an immediate 5 to 10 dB improvement in upstream MER.
You can see an example of this below. The first image shows you an upstream 6.4 MHz 64-QAM signal that is experiencing significant tilt. The second image is what the signal looks like to the CMTS after it has been pre-equalized.
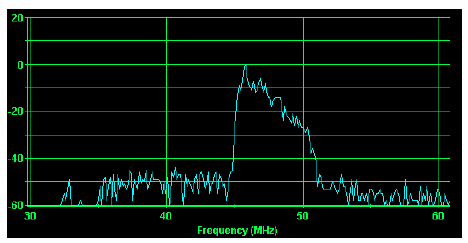
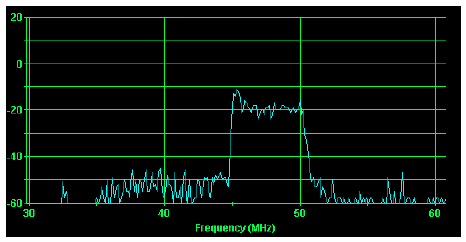
From CableLabs® PNM Best Practices: HFC Networks (DOCSIS 3.0) CM-GL-PNMP-V03-160725.
Does Pre-equalization fix issues or hide them?
As you can see, turning on pre-eq can make a significant difference in subscriber experience. But, it does not actually fix the underlying issue that is causing the signal problem. So, from that perspective, it's only a band-aid. The cause of the problem is still there, whether that be a corroded or loose connector somewhere, or maybe a length of cable with radial cracks or a squirrel chew. And, not only does the problem still exist, but when pre-eq is turned on, the diagnostics applications we normally use to track modem performance won't pick up on the symptoms of those issues. The metrics they normally alert on—things like like bad MER/SNR, out-of-spec power levels, codeword errors and flaps, will not be seen by the diagnostics software because pre-eq is compensating for any upstream RF impairments in the plant that are degrading the signal.
Of course, one thing that every cable technician knows is that faults in the cable plant don't magically get better, and almost always get worse over time. There will be a point when pre-eq is no longer able to distort the signal enough to compensate, and at that point one or more modems will go off-line. Also, if an impairment starts to hover on the edge of that cliff, it may present itself as an intermittent problem. For example, it may first occur only when there are changes to air temperature or moisture levels in the outside plant. It would be at those times when service is intermittently impacted and one or more customers might call to complain. Not only does that mean sending a technician after service is affected, but it can also mean repeat calls if the problem cannot be seen when the technician is actually there to troubleshoot the issue.
How do Pre-Eq and DOCSIS PNM Work Together?
You might be thinking at this point that perhaps turning on pre-equalization is not a good idea, since it can mask the symptoms of an underlying problem. Fortunately, DOCSIS PNM tools are able to look at the pre-equalization coefficients, and by analyzing that data they can display which modems are working the hardest to compensate for impairments like micro-reflections and group delay. This gives the cable operator the best of both worlds. They can allow pre-eq to do its thing and provide immediate service improvement as it automatically compensates for upstream impairments; and, the PNM application lets them know in advance which devices to keep an eye on—even if the signal looks just fine to their SNMP-based monitoring system.
What can a DOCSIS PNM Application Tell You?
Based on how the CPE is distorting its signal, the PNM application can tell you the severity of the impairment, the type of impairment, and its approximate location in the plant. For example, you can see if the impairment is an open or a short, if the distortion is a micro-reflection or group delay, and how hard the modem is working to overcome the fault. You can also see pretty quickly whether the issue is likely in the home, near the home (between the home and the drop), or further out in the plant somewhere. You can even get an estimate of where to go look in the mainline plant for faults that are impacting multiple devices, which could eventually cause service issues for multiple customers in the future. The PNM application can tell all of this by analyzing the digital taps and In-channel Frequency Response from the CPE.
What is a digital tap? (i.e. when a "tap" is not a "tap")
When cable techs hear the word "tap", they tend to think about the physical taps in the cable plant that are used to connect a drop cable to a mainline cable. A "tap" in the pre-eq world is a digital tap that represents a slice or sampling point in the signal and equalization coefficients. Those slices, or taps, can then be adjusted to cancel out the linear distortion being seen by the CMTS. You can think of these taps like the sliders that you would see on a graphic equalizer on an audio system, which are used to adjust different frequency bands to improve sound quality, or even to compensate for acoustic issues in a room.
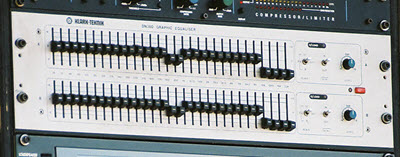
The digital taps used by pre-eq are also meant to adjust the signal quality—in this case the RF signal—by sending the inverse channel response from what the CMTS is receiving in order to provide the optimal frequency response. DOCSIS 1.1 devices supported 8 digital taps, which did not give you much sampling granularity or adjustment capability. That would be like a graphic equalizer for audio having only eight sliders to adjust the sound. DOCSIS 2.0 and higher CPE have 24 taps that can be analyzed and adjusted.
Here is a typical digital tap chart for a cable modem shown in our PreEqualization Analyzer PNM application. While some of the taps are elevated, none have exceeded the red threshold line, which would indicate an issue that should be addressed.
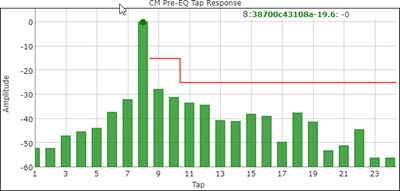
Just looking at the digital tap response for a particular device in a PNM application can give you a lot of information. The main tap is tap number 8 and it is supposed to have the highest energy passing through it. In fact, if there were no impairments impacting the device, then all the energy would be passing through tap 8 and the other taps would be level and flat. The seven taps to the left of the main tap are the pre-main taps. The sixteen taps to the right of the main tap are the post-main taps. If the post-main taps are elevated it means the CPE is pushing power through those taps to compensate for a micro-reflection. The higher a particular tap is, the more energy is being sent through that tap to overcome the distortion—which means the worse the impedance mismatch is, and thus the worse the actual fault is. Taps just to the right of the main tap (like taps 9 and 10) indicate the issue is in the home, or is near to the home such as at the drop. Taps that are further to the right of the main tap that are elevated would indicate a longer reflection distance, which would be indicative of a problem further out in the plant. The further to the right an elevated tap is from the main tap, the bigger the distance of the reflection. Taps to the left of the main tap that are elevated indicate the presence of group delay. PNM Applications use the relationship of the taps to calculate an approximate distance of an echo cavity, which provides technicians with a good idea of where to look for the fault.
What's the difference between Micro-reflections and Group Delay?
Micro-reflections and Group Delay are similar. If you look at it simply, the difference can be considered the degree of the distortion. With group delay the fault is causing some signals to be delayed so that they arrive at the CMTS later then other parts of the signal (nano-seconds later). Group Delay is going to be worse when the signal is near band edges and where there is diplex filter roll-off.
Micro-reflections occur when the upstream fault is bad enough that some of the signal is reflected back downstream, where it then encounters an active device like an amplifier, and is reflected back upstream toward the CMTS. In this case the CMTS will start processing the main signal and then receive the reflected signal. This can cause standing waves and degrade MER. Depending on the severity of the reflection, this can also cause codeword errors. Those errors may be correctable, but if the issue is severe enough you will see uncorrectable codeword errors and service will be impacted. Micro-reflections can also be a cause of Group Delay. Again, DOCSIS pre-equalization can compensate to a point for micro-reflections and Group Delay so they are non-customer impacting, and PNM applications can help you locate the underlying cause before they get so bad that they start to impact service.
Main Tap Compression (MTC)
One of the metrics a PNM application tracks is Main Tap Compression. MTC is the ratio of the total energy passing through all other taps relative to the energy in the main tap. As MTC rises, it can be a good indicator of how much headroom is left for a modem to sufficiently pre-distort the RF signal to compensate for an impairment. If the MTC hits 2 dB, the device will likely no longer be able to compensate for the impairment. A 2 dB MTC means that the the CMTS is receiving 2 dB less input power.
In-Channel Frequency Response (ICFR)
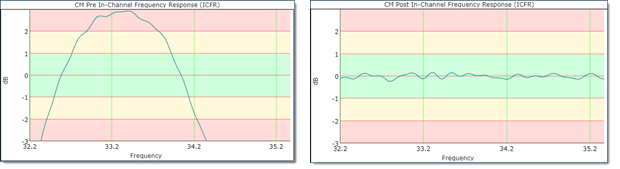
PNM applications also look at the In-Channel Frequency Response of the modem. The ICFR describes the "flatness" of a channel or frequency range, and is the difference in dB between the peak of the signal and the valley. The upstream requirement in DOCSIS peak-to-valley for a frequency is 0.5 dB per 1 MHz of frequency. So, if a channel is 6 MHz wide you would need to be 3 dB peak-to-valley or less to be within spec for ICFR . The image below from our PNM application shows you the ICFR for a cable modem before pre-equalization and after. You can see from the ICFR chart that the original upstream signal seen by the CMTS is severely impaired prior to pre-equalization. After pre-equalization the signal is almost flat and well within the green band, which indicates a good signal now being received by the CMTS.
 .
.
TDR and vTDR
In a PNM application you will often see a TDR figure and a vTDR figure. TDR stands for Time Domain Reflectometery if speaking of the method, or Reflectometer when speaking of a tool. Often the acronym TDR brings to mind a piece of physical test equipment that you would connect to the cable plant. It shoots a signal down the line looking for and analyzing any reflections to try to isolate the severity and location of the impairment. Sound familiar? One of the problems, though, of using a TDR in the field is it usually disrupts service as you disconnect segments of the plant looking for issues. That's why PNM is so powerful. Instead of running around in the field disconnecting your plant to find reflections, PNM uses the pre-eq data from the CPE to see the impact of the reflection and estimate the reflection distance. The TDR or vTDR figure in the application gives you an idea of the length of the reflective echo cavity, which can tell you where to start looking for the problem. In our PreEqualization Analyzer application we display a TDR distance, which estimates the reflective distance of in-home and near-home issues, and vTDR distance, which estimates the reflective distance of impairments further out in the mainline plant.
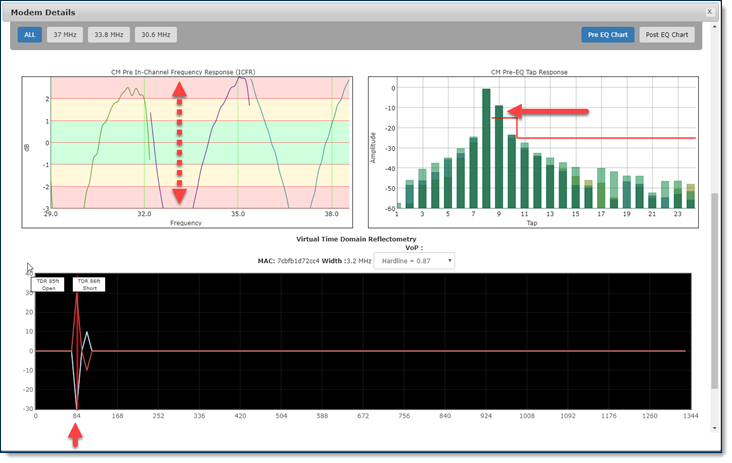
For example, in the image below, you see a cable modem digital tap chart with tap number 9 elevated above the red threshold line. You also see a large swing well over 6 dB in the In-Channel Frequency Response (ICFR) on all channels, when the optimum ICFR should be a flat line (or at least within the green-shaded area). There is also an estimated TDR of 85 to 86 feet on the three upstream channels.
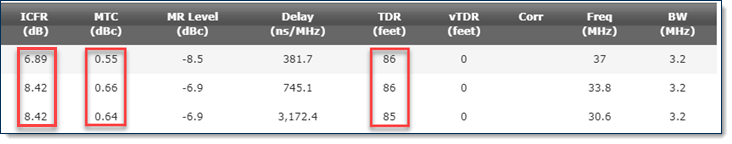
The data table below for that same device shows that the Main Tap Compression is over the DOCSIS standard of .05 dB, so it has reached the point where pre-equalization may not be compensating for the impairment. You can also see the ICFR and TDR readings in the table. The vTDR distance is zero, which indicates that there is not an impairment further out in the plant affecting this device. You can also see this from the digital taps in the chart above, where none of the taps past tap number ten are elevated, also indicating that there is not a fault further out in the plant impacting this device.
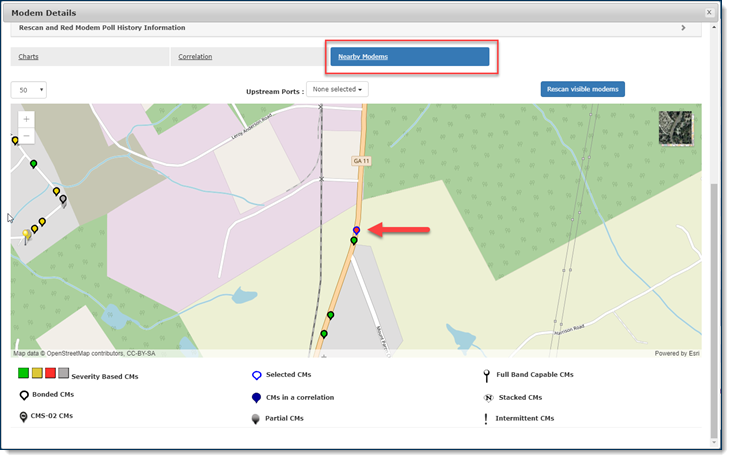
Below you can see how the PNM application has plotted this device on the map with other nearby modems and flagged it as red showing it is out of spec. The modems near it are green. From this PNM data and what we see on the map we can surmise that this is probably something like a loose connector somewhere at or in the home.
Reducing Ingress in the Upstream with PNM Tools
It's important to note that in addition to causing service problems for this subscriber, the fault causing this impairment above could be allowing significant noise to leak into the upstream plant, which can cause issues for other subscribers on these same upstreams. For example, our PreEqualization Analyzer PNM tool has a feature that can help you track down ingress in your return path. It's called an Intermittent Modem Report, and it looks at variations in modem power levels in comparison to PNM data to identify devices that have a high probability of leaking ingress or impulse noise into the upstream. These devices are generally going to be the ones that are most likely leaking noise in (and out) of your upstream plant. This allows you to target those homes which are likely ingress points as your first priority for proactive maintenance at or near the home. About 90% of the ingress points in the cable plant are in-home or near-home, so addressing these issues proactively and methodically will significantly reduce ingress on the return path and improve service for all subscribers. Reducing those in-home and near-home issues also helps improve the accuracy of the algorithm that determines which devices are being affected by a common impairment, which is the next topic.
Finding Impairments Impacting Multiple Subscribers
PNM applications are also able to compare the pre-eq readings from different nearby modems on the same channel. If there is a strong correlation in the pre-eq signature from multiple modems, that would indicate that those devices are all being impacted by a common impairment. For example, there may be a cracked cable in the plant where moisture has leaked in, and it is causing a micro-reflection that is affecting multiple modems. The echo cavity would be the same distance for those devices, so the digital tap response and ICFR for those devices would look very similar.
The PNM application can alert you to these correlation groups and display the affected devices on a map. In the screen shot below from PreEqualization Analyzer you see where the application has identified a strong correlation group. The affected modems are identified on the map with the dark blue pins. You can also see how similar the In-channel Frequency Response is for all of the correlated devices.
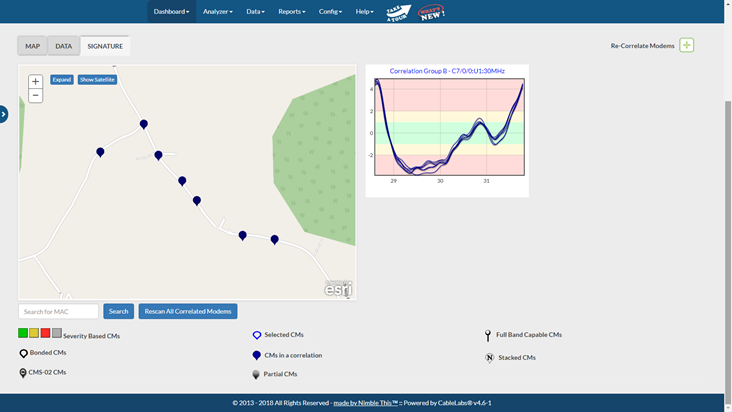
In addition, the PNM application will give you an approximate length of the echo cavity via a vTDR distance. By looking at the last correlated modem on the PNM map and the vTDR distance, along with the actives and passives in your plant in that area, you have a lot of information to begin your search for the location of the fault. In PreEqualization Analyzer you can also upload digital strand maps as an overlay on top of the PNM map, making it even easier to track down the source of the problem.
As you can see, DOCSIS Proactive Network Maintenance (PNM) is a powerful tool that is now available to cable operators, helping them address problems in their RF plant before service is impacted for the customer. Lower operating costs, fewer unplanned outages, a cleaner RF plant, and a better experience for the subscriber are just a few of the benefits you will see from using a PNM application and implementing a proactive methodology in your maintenance organization.
If you found this article helpful, please let us know by commenting below. You can also share it with others by clicking one of the social icons below.
About the Author: Rick Yuzzi

Leave a comment: